Part 3 of 5 in The Software City
The Architect's View from the Sky
A New Perspective
For years, the architect of our story has felt like an archaeologist. Her days were spent piecing together the history of a sprawling corporate system from fragmented artifacts: outdated diagrams, conflicting documentation, and the hazy memories of senior engineers. She had a sense of the individual pieces but no true understanding of the whole. The system's complexity was a fog she couldn't see through.
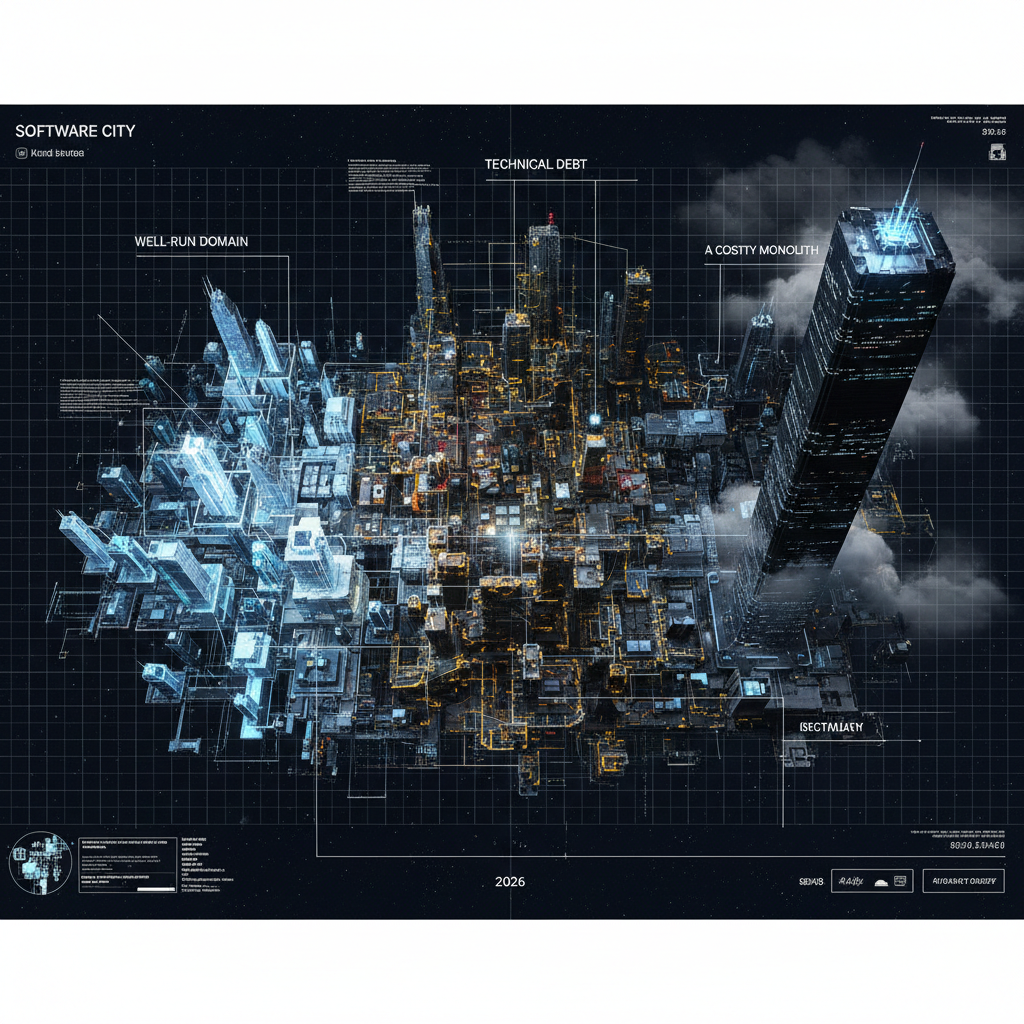
The Software City changes her perspective. Instead of digging through ruins, she can now ascend and see the entire landscape from above. From this vantage point, the fog lifts, and for the first time, she can read the story of her system in the language of a city.
Reading the Skyline
From her "helicopter view," the architect immediately begins to see patterns that were previously invisible.
The Towers of Cost: The first thing she notices are the skyscrapers. In the "Billing" and "Data-Processing" districts, a few colossal towers dominate the skyline, their height representing their enormous operational and personnel costs. For years, these costs were just numbers in a quarterly report, but now they are physically present, impossible to ignore. She can see, not just calculate, where the money is going.
The Bright Highways of Traffic: As she observes the city, she sees vibrant streams of light flowing between the buildings—the live traffic of user requests. She can clearly identify the major highways: the critical paths that connect the public-facing API gateways to the core services. She also sees the surprising traffic jams, the bottlenecks where the light slows to a crawl, revealing performance issues in real-time.
Identifying Zones of Risk and Neglect
As her eyes adjust to the landscape, she starts to notice the more subtle, and often more dangerous, patterns.
Decay Zones: Certain older neighborhoods look rough. The buildings are styled in an archaic design, and their facades are crumbling. These are the "Decay Zones"—areas of high technical debt. They are the legacy services that are expensive to maintain and slow down any new development. The city gives her a clear, visual map of where to direct her modernization efforts.
Ghost Towns: At the periphery of the city, she spots entire districts that are dark. No lights, no traffic. These are the ghost towns: forgotten services, abandoned proofs-of-concept, and zombie cron jobs still consuming resources but providing no value. They are security risks and wasted cost, now clearly marked for decommissioning.
The Red-Light Districts of Failure: The architect can also change her lens, coloring the city not by cost or traffic, but by error rates. Instantly, certain areas glow red. She sees a "hot zone" where a critical, high-traffic service is also throwing a high number of errors. She sees how a failure in one building can cause a cascade of smaller "fires" in the buildings connected to it. This isn't a list of alerts; it's a living map of the system's fragility.
From Archaeologist to City Planner
This new perspective is transformative. The architect is no longer just reacting to problems as they arise. She can see the systemic issues, the emerging risks, and the hidden costs. She can identify which highways need to be widened, which decaying neighborhoods need to be revitalized, and which ghost towns need to be bulldozed.
She has finally moved from being an archaeologist of the past to a planner of the future. The Software City has given her the one thing no diagram ever could: a true, holistic understanding of the system as a living entity.
In the next article, we will descend from this high-level view and land on the streets, seeing the city through the eyes of the engineer who has to live and work there every day.